Reconciled performance record
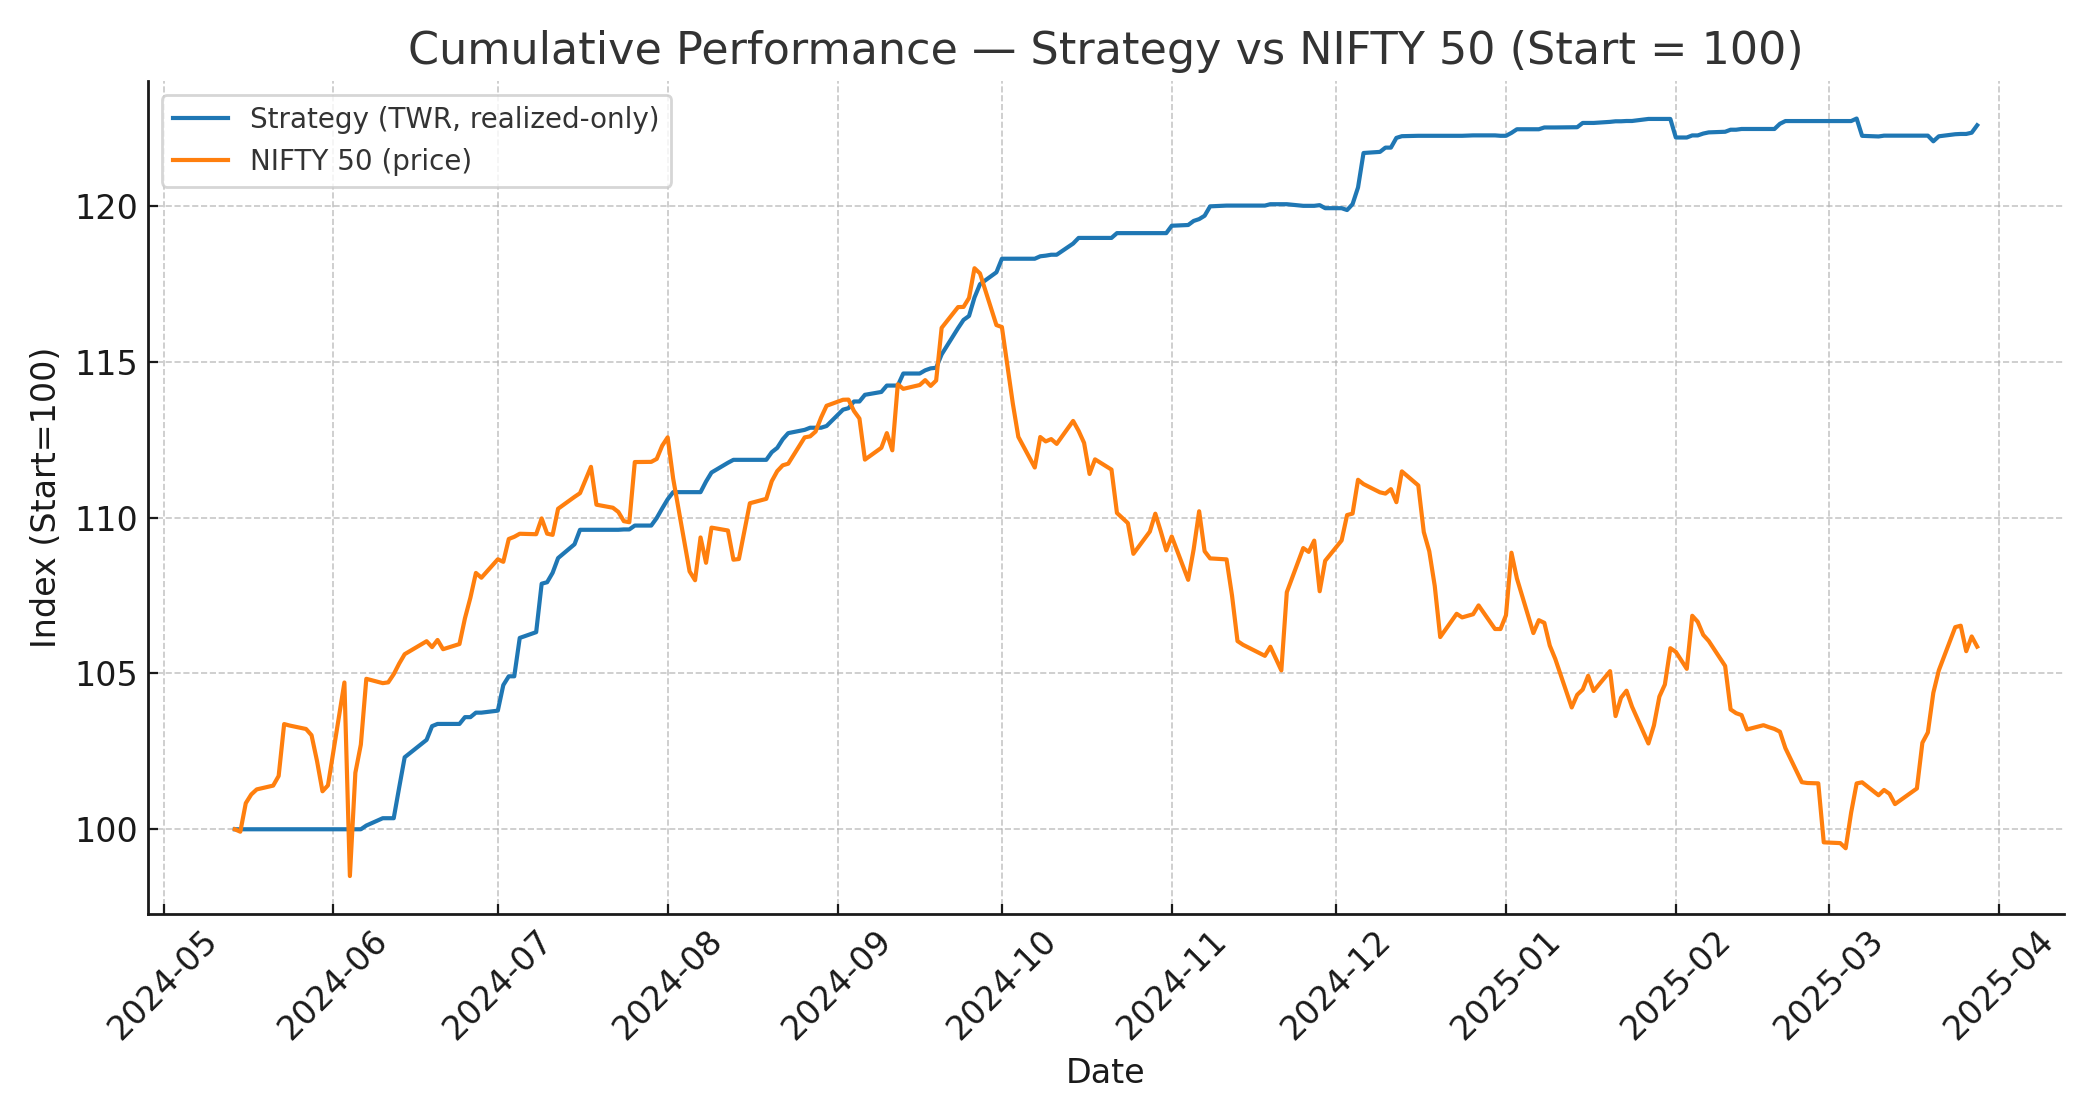
TWR outperforms NIFTY 50
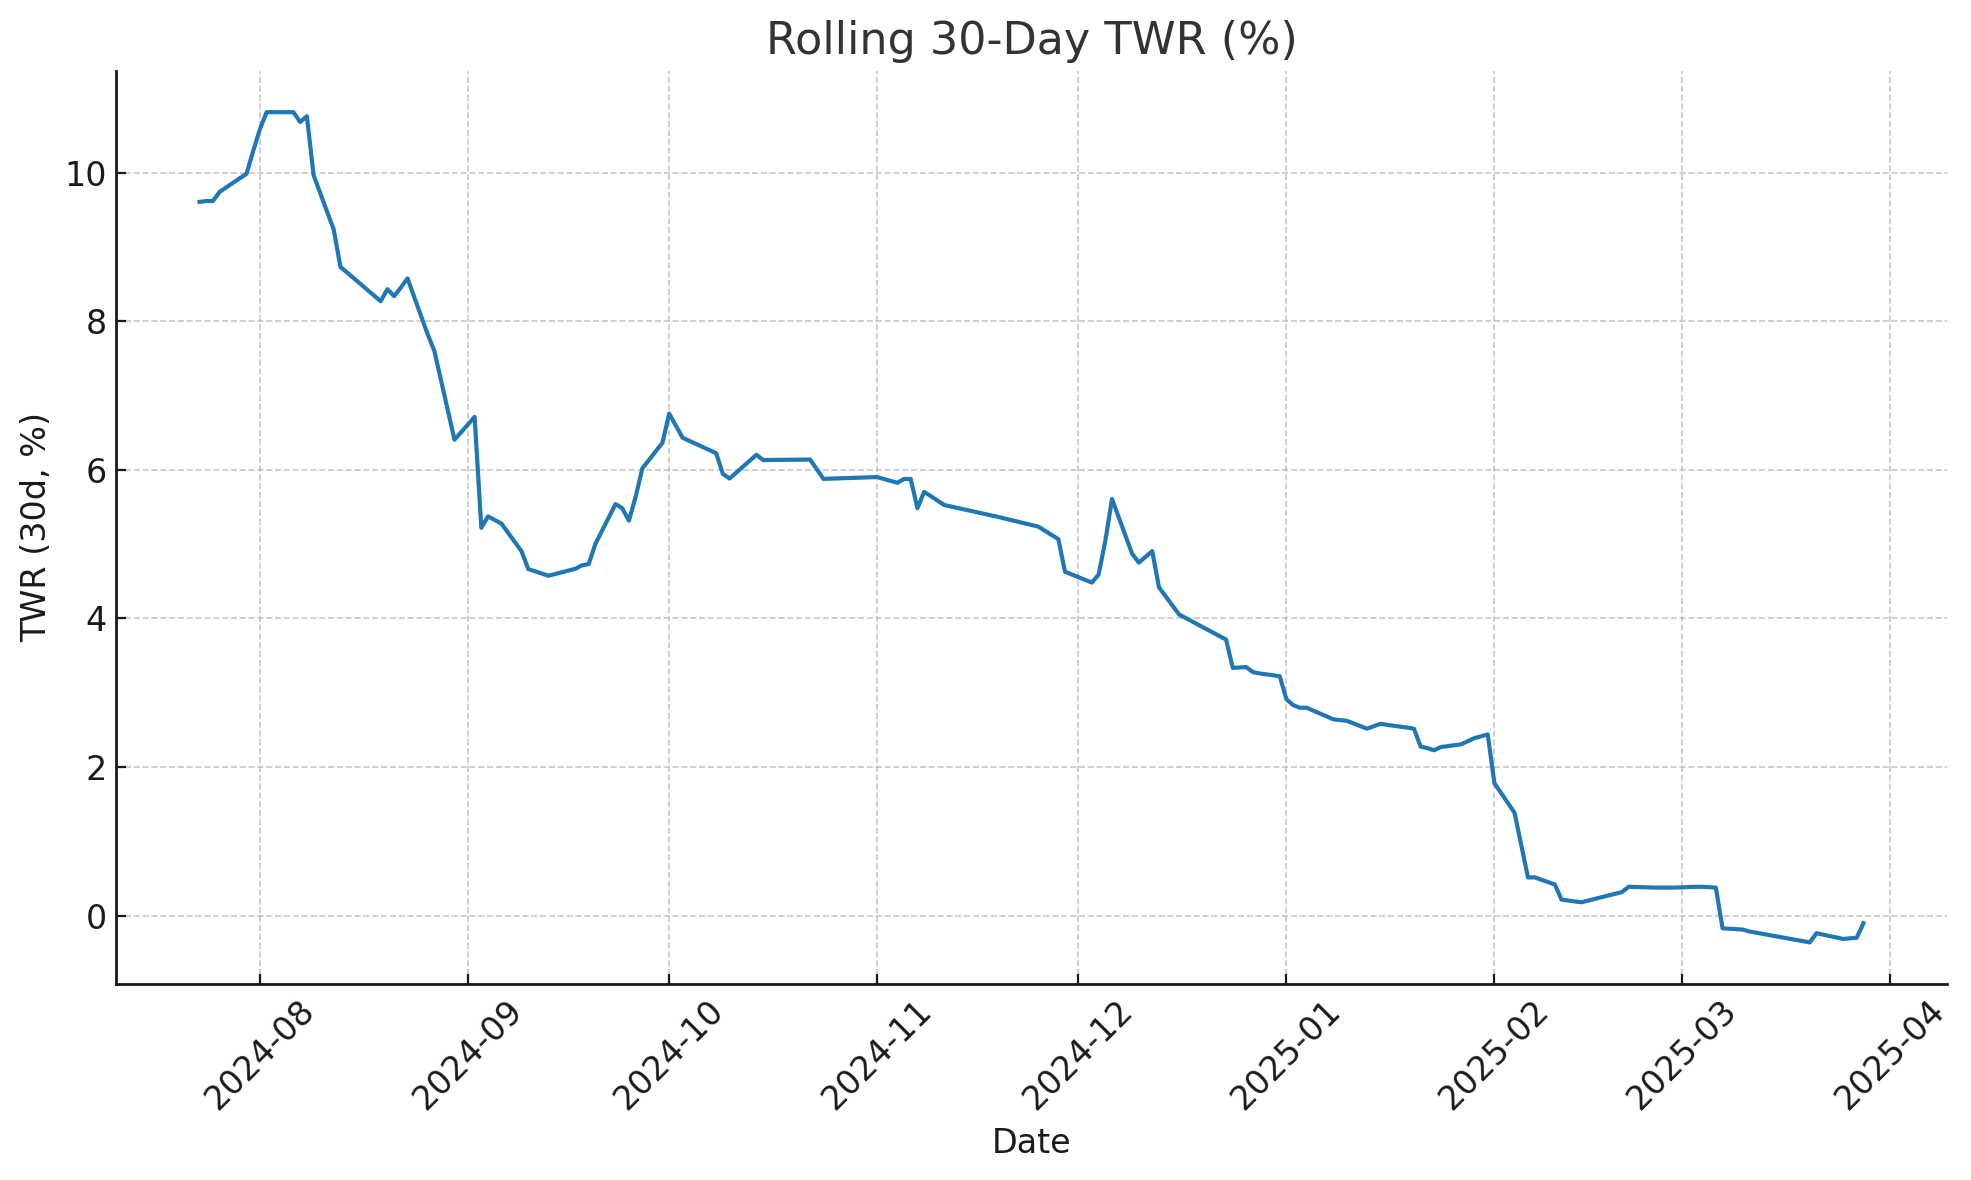
2024-05-14 → 2025-03-28. Numbers are flow-neutral Time-Weighted Returns (TWR), using broker statements and ledger cashflow files. No MTM, no derivatives.
TWR (desk)
22.58%
NIFTY 50
5.86%
Excess 16.72%
Winning days
71.03%
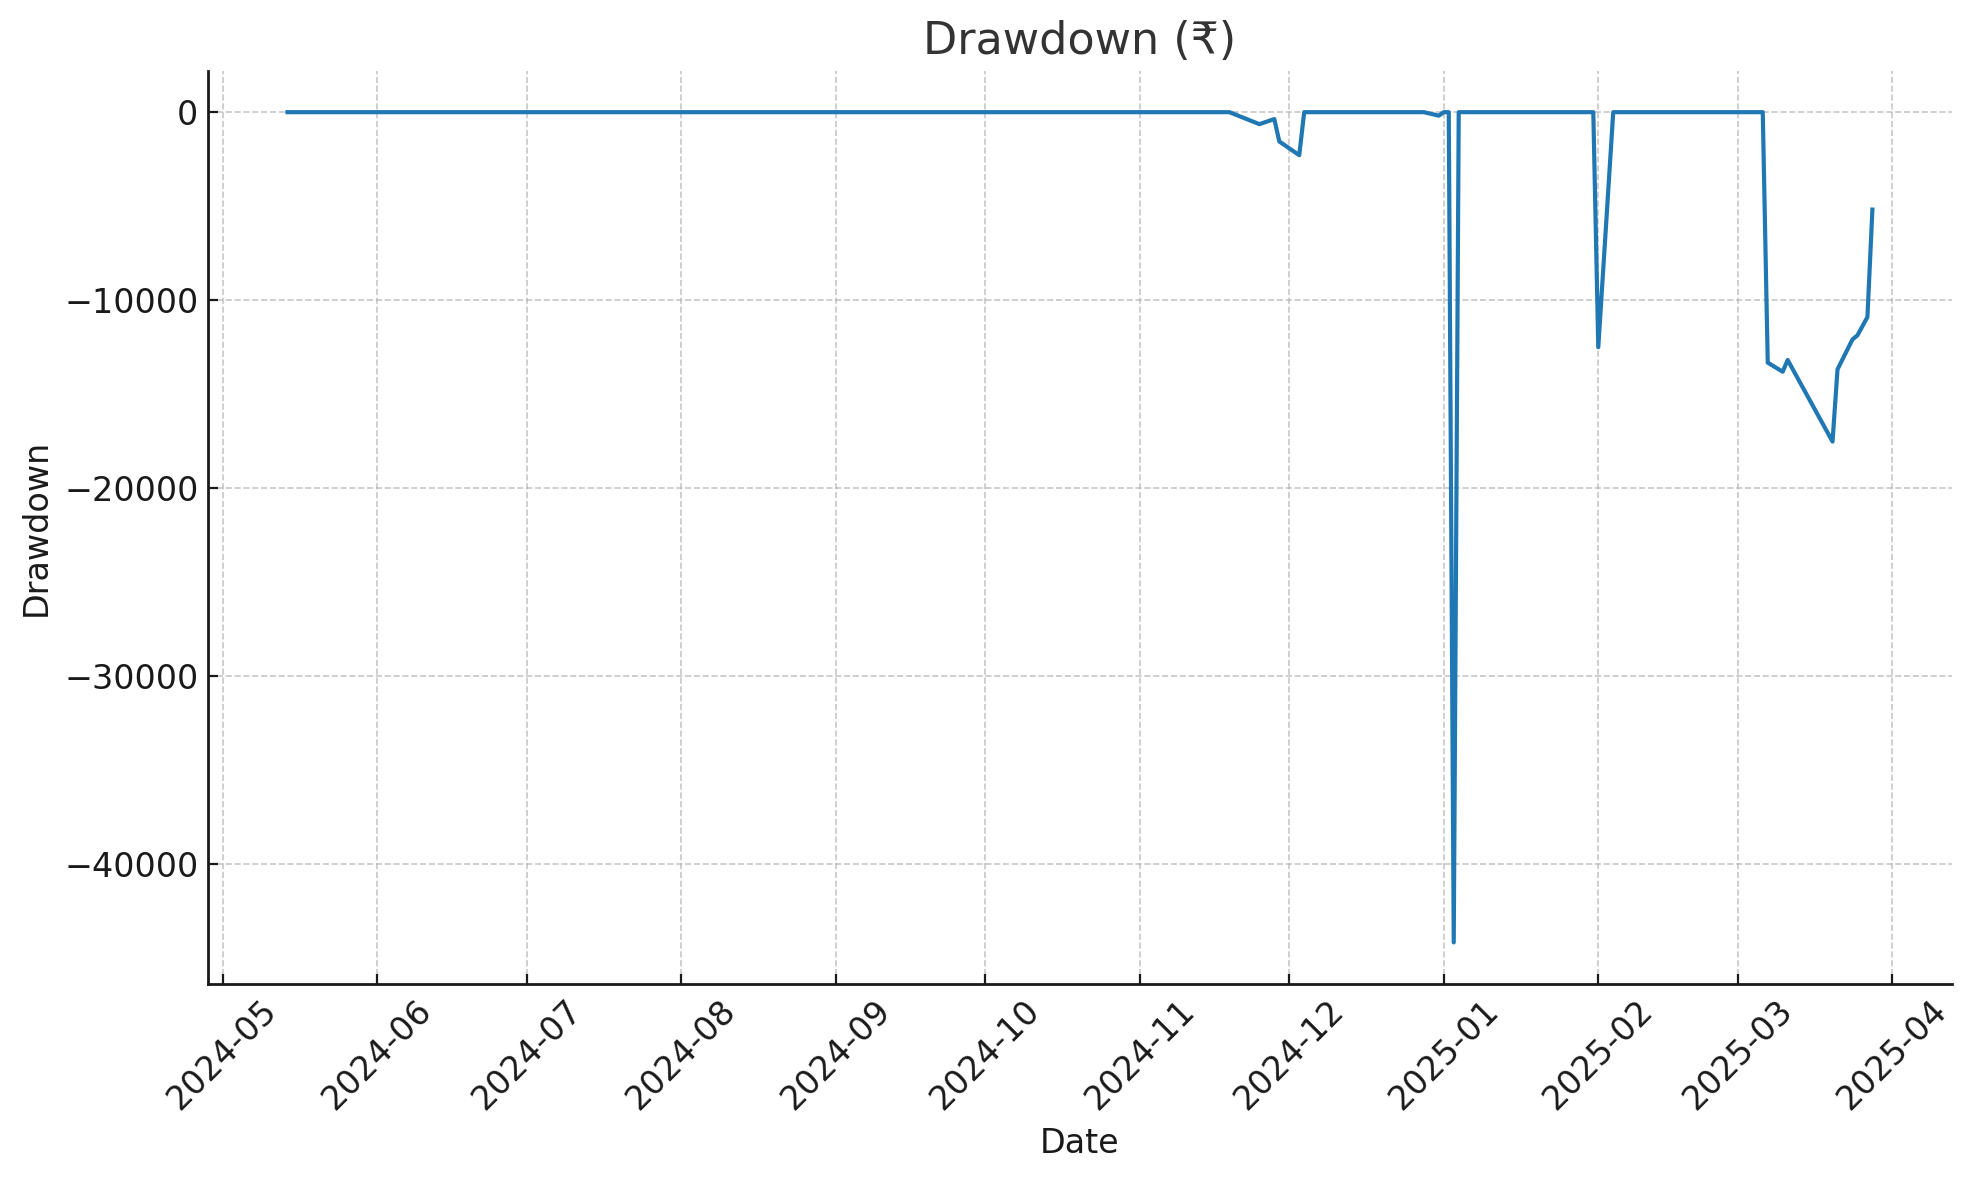
Max drawdown
-2.48%
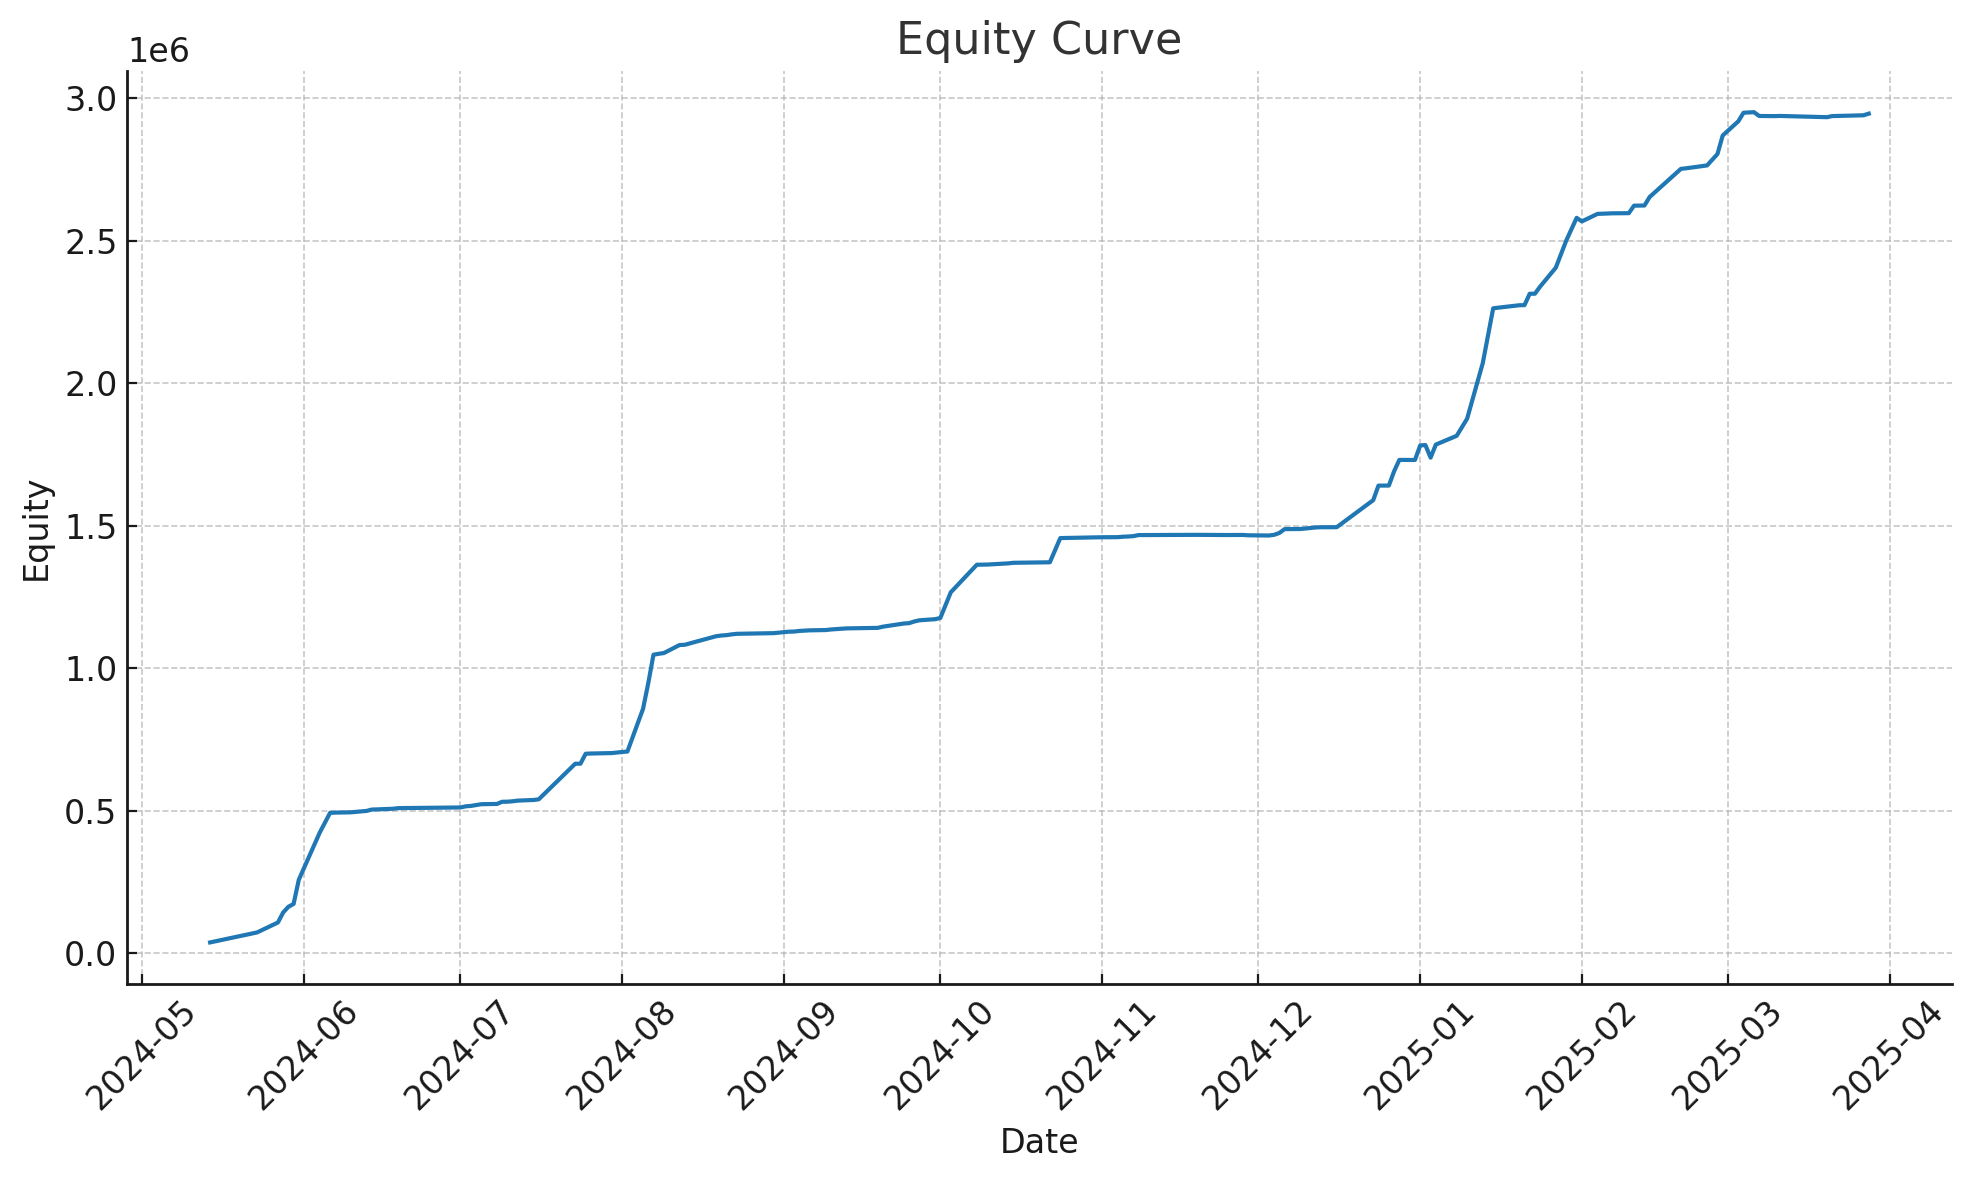
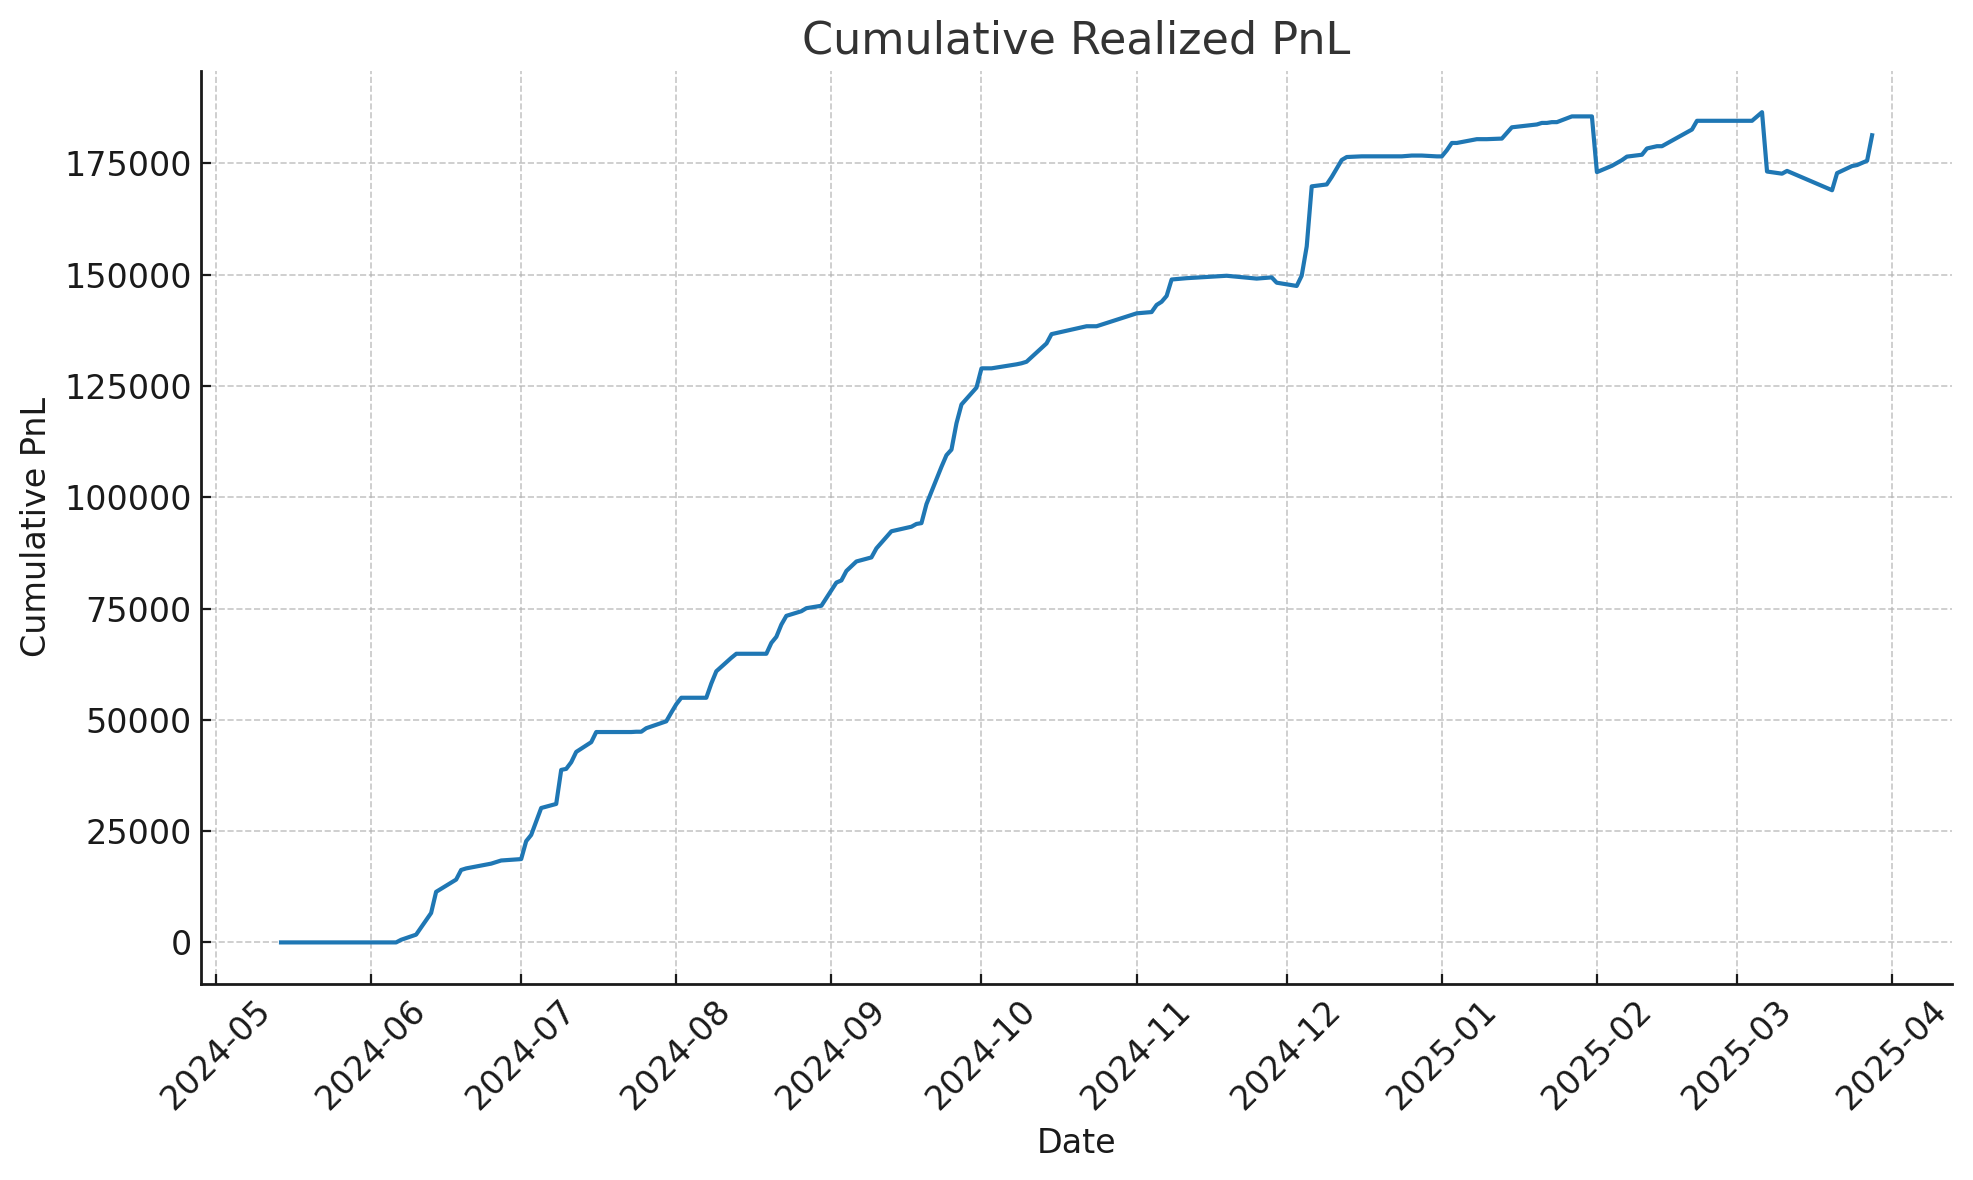
Charts at a glance
These are realized-only views pulled from broker statements. No synthetic MTM. Each chart is available on request as part of the proof pack.
Verification stack
- Source of truth: broker contract notes + bank ledger exports.
- PnL engine: strict FIFO per symbol, short reconciliation, realized-only.
- TWR math: daily realized PnL ÷ start-of-day equity, compounded.
- Benchmark: NIFTY 50 spot closes, normalized to 100 on 2024-05-14.
Charts only are public; raw files stay private. Request a proof pack if you need sample statements, ledger extracts, and checksums.
Proof ID · a64d988b4e
TWR in one minute
- TWR strips deposits/withdrawals so you see pure strategy skill.
- Daily return = realized PnL ÷ start-of-day equity. We compound those values.
- If desk TWR > index return for the same dates, we outperformed.
Ready to deploy?
Start with Telegram signals or plug into full automation with Flattrade / Shoonya APIs.